Scraping wildfire timeseries data with NLP
New Mexico is facing a severe fire season, and I wanted to visualize the progression of the major fires that are currently ongoing. However, I could not find a usable source of data on daily size and containment statistics.
A repository of daily updates exists, however as articles rather than structured data. I ended up scraping the website and applying natural language processing to extract the desired data.
The library and utility is available on my GitHub.
InciWeb contains a collection of the daily updates for the fires of interest, and by using Beautiful Soup I was able to collect and scrape all the articles. This was fairly straightforward.
Extracting the information of interest proved to be the more difficult task. Posts on the site come from various agencies and thus do not follow a consistent format. In order to handle all posts in generality, I turned to a NLP technique.
Using NLTK, I converted the words of the articles into their stems, then found the concordance lists of keywords pertaining to the data I needed.
After tagging the concordance strings with parts of speech, I was able to find the closest number to each keyword; this proved to be a fairly reliable heuristic.
def get_best_value(text, value_tag, label_values):
    """ Apply the heuristic to extract the closest string with the specified tag
        to one of the label values
    """
    val = None
    dist = 0

    concordance_list = []
    for l in label_values:
        concordance_list += text.concordance_list(l)

    for s in concordance_list:
        tags = nltk.pos_tag(nltk.tokenize.word_tokenize(s.line))

        label_candidates = []
        value_candidates = []

        for i, (token, tag) in enumerate(tags):
            if tag == value_tag:
                value_candidates.append((token, i))
            elif token.lower() in label_values:
                label_candidates.append((token, i))

        for l, i in label_candidates:
            for v, j in value_candidates:
                d = abs(i - j)
                if val is None or d <= dist:
                    val = v
                    dist = d

    return val

def extract_data(raw_article_text):
    """ Returns the size and containment of the fire by applying the heuristics to the text
    """
    stemmer = nltk.stem.WordNetLemmatizer()
    words = nltk.tokenize.word_tokenize(raw_article_text)
    tokens = [stemmer.lemmatize(w) for w in words]
    text = nltk.text.Text(tokens)
    size = get_best_value(text, 'CD', ['acre', 'acres'])
    containment = get_best_value(text, "CD", ['contained', 'containment'])
    return size, containment
The rest of the code is not interesting, but eventually I was able to automate gathering most of the data I needed to produce this plot.
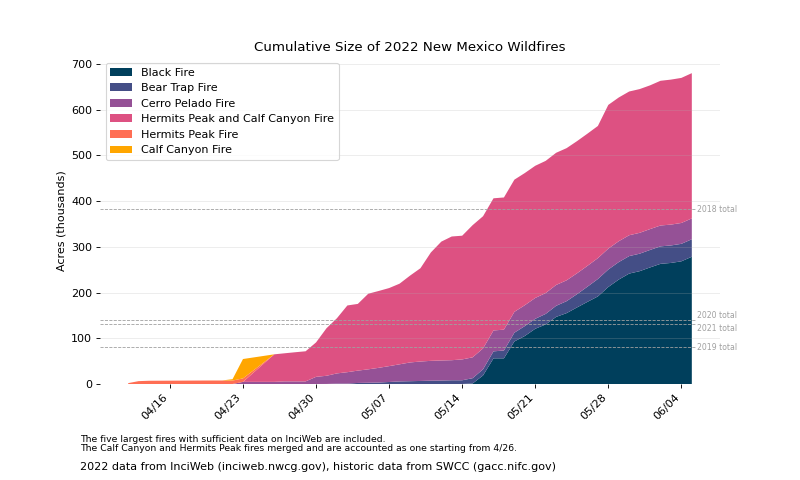
I used the utility in the above GitHub repository to dump the timeseries data from InciWeb to CSV, gathered some historical numbers from SWCC, and wrote a script to put it all together with matplotlib.