An easy way to visualize git activity
Today, I wrote gitply – a fairly simple Python script for visualizing the weekly activity of each contributor to a git repository.
It started out as a run-once script to get some statistics for one of my projects, but I ended up improving it incrementally until it turned into something friendly enough for other people to use.
What it does:
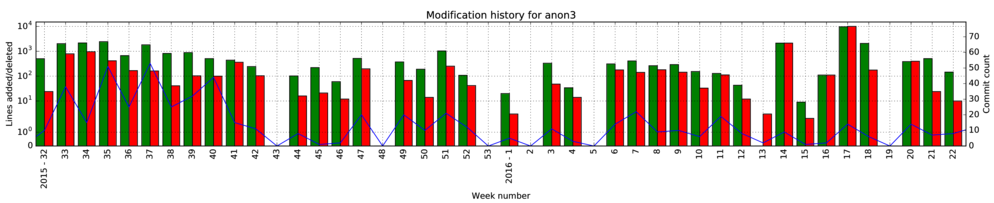
You’ll get a graph like this for each contributor. What all do we see here?
- Lines inserted (green bars, left axis, log scale)
- Lines deleted (red bars, left axis, log scale)
- Commits made (blue line, right axis, linear scale)
You also get a textual representation of the same data:
History for anon2
  2016, week  6:  2 commits, +366  -26
  2016, week  7:  4 commits, +325  -5
  2016, week  8:  2 commits, +224  -3
  2016, week  9: 21 commits, +2617 -219
  -- Gap of 2 weeks
  2016, week 12: 10 commits, +4066 -614
  2016, week 13:  6 commits, +2480 -432
  2016, week 14:  2 commits, +654  -490
  -- Gap of 1 week
  2016, week 16:  2 commits, +661  -229
  -- Gap of 2 weeks
  2016, week 19:  3 commits, +1508 -47
  -- Gap of 2 weeks
  2016, week 22:  1 commits, +1490 -29

History for anon1
  2016, week 12:  1 commits, +143  -89
  2016, week 13:  2 commits, +58   -16
  2016, week 14:  3 commits, +137  -17
  2016, week 15:  2 commits, +403  -106
  -- Gap of 2 weeks
  2016, week 18:  5 commits, +134  -38
  -- Gap of 3 weeks
  2016, week 22:  1 commits, +13   -1
  2016, week 23:  1 commits, +485  -1
If you just want to download it and use it already, check out the project on GitHub. For those who are interested, some implementation details follow.
How does it work?
The first thing gitply does is invoke the standard git client to retrieve a log:
$ git log --numstat --date=short --no-notes
Then, it analyzes the log line-by-line in real time (thanks, Python iterators) in order to get the data we need. Essentially, we create an iterator that yields tuples of (email, date, stats) for each commit, where stats is the pair (insertions, deletions).
Once we create this iterator over the commit history, we can attribute each commit to a user and ultimately fill in a dictionary that will help us print the analysis. We sum the insertions, deletions, and commits for each ISO week, then iterate through the weeks and print out the final results.
Now, if for some reason you need an iterator over the commits in a repository, you can import my iterate_commits function from this script and use it yourself.
What’s next?
Right now, gitply supports aggregating statistics from several repositories into one report. One planned feature is to use stacked bars and lines to show the amount of activity per-project, per-user, per-week. Until then, the data from multiple repositories will all be displayed together.